This section describes the MD simulation results of the self-peptide anx and microbial peptides kp1, kp2, and kp3. The analysis focuses on structural stability, flexibility, compactness, solvent exposure, and hydrogen-bonding behavior to evaluate similarities between microbial peptides and the self-peptide, which may indicate molecular mimicry potential.
Solvent Accessible Surface Area (SASA)
SASA measures how much of a peptide surface is exposed to the surrounding solvent during the simulation. Higher SASA values indicate a more exposed or extended structure, while lower values indicate a more compact or buried conformation.
In this work anx shows consistently higher SASA values, indicating greater solvent exposure.
kp1 shows SASA values close to anx but slightly lower.
kp2 and kp3 show relatively lower SASA, suggesting more buried conformations.
All peptides remain stable over time with no abrupt SASA jumps, indicating well-equilibrated systems.
Figure 1 shows the SASA plot for all peptides over time.
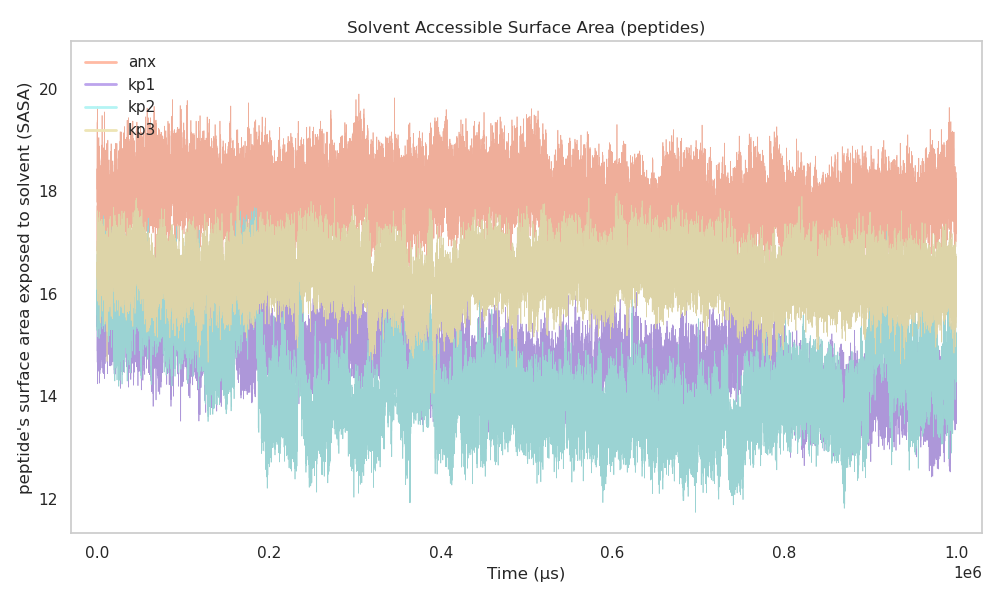
Figure 1:SASA vs Time for anx, kp1, kp2, and kp3
Overall, the SASA analysis suggests that anx and kp1 share comparable solvent exposure behavior, whereas kp2 and kp3 tend to remain more buried. This similarity between anx and kp1 is important when considering structural mimicry.
Root Mean Square Deviation (RMSD)
RMSD measures the overall structural deviation of the peptide backbone from its initial structure over time. Lower RMSD values indicate higher structural stability.
anx shows low and stable RMSD throughout the simulation.
kp1 follows a similar RMSD pattern to anx.
kp2 shows moderate fluctuations.
kp3 displays the highest RMSD, indicating significant conformational changes.
Figure 2 shows the RMSD plot for all peptides.
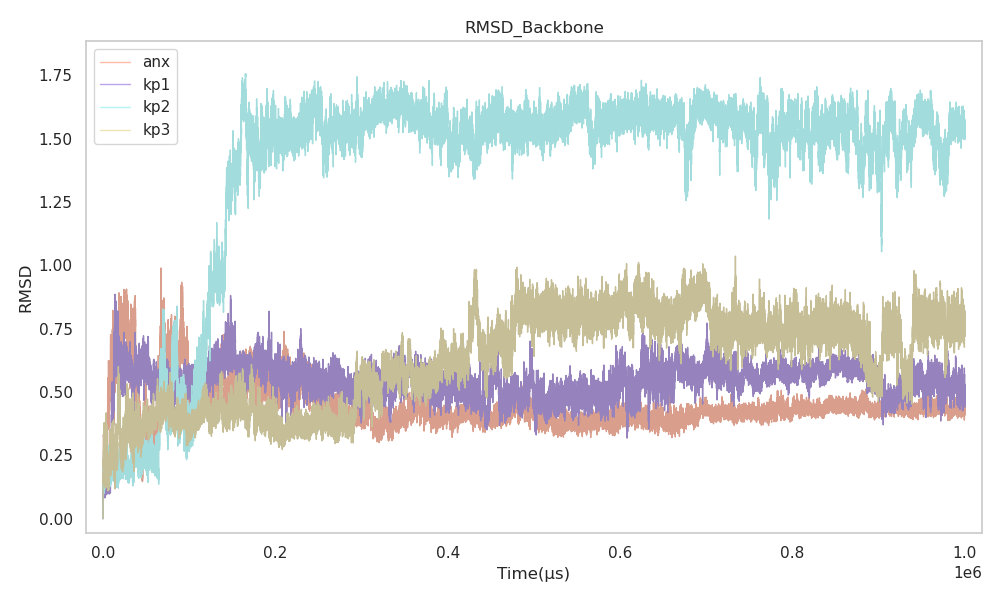
Figure 2:Backbone RMSD vs Time
The RMSD results indicate that kp1 is structurally closest to anx, while kp3 is the least stable. This further supports kp1 as a potential mimic candidate.
Root Mean Square Fluctuation (RMSF)
RMSF provides residue-wise flexibility information and highlights which parts of the peptide are more dynamic.
anx and kp1 show low RMSF across most residues.
kp2 shows moderate flexibility.
kp3 shows the highest fluctuations, especially at the C-terminal residues.
Figure 3 shows the SASA plot for all peptides over time.
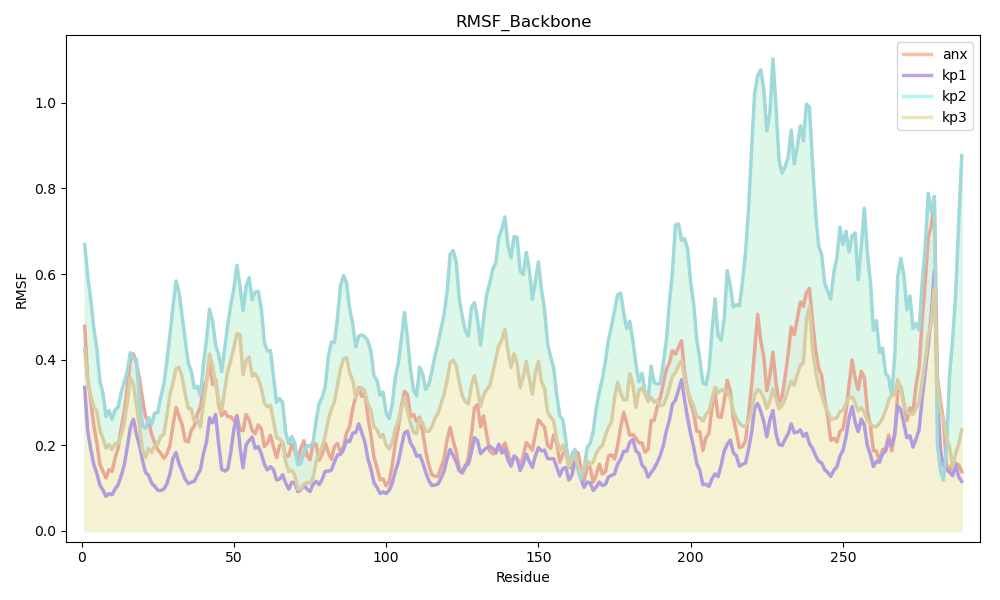
Figure 3:RMSF vs Residue Number
Lower RMSF values for anx and kp1 indicate restricted residue mobility, suggesting similar internal dynamics. kp3’s high flexibility reduces its likelihood of mimicking anx.
Radius of Gyration (Rg)
The radius of gyration (Rg) measures the overall compactness of the peptide–protein complex. Lower values indicate a more compact structure.
anx forms the most compact complex.
kp1 shows Rg values close to anx.
kp2 and kp3 have higher Rg values, indicating looser packing.
Figure 4 shows the SASA plot for all peptides over time.
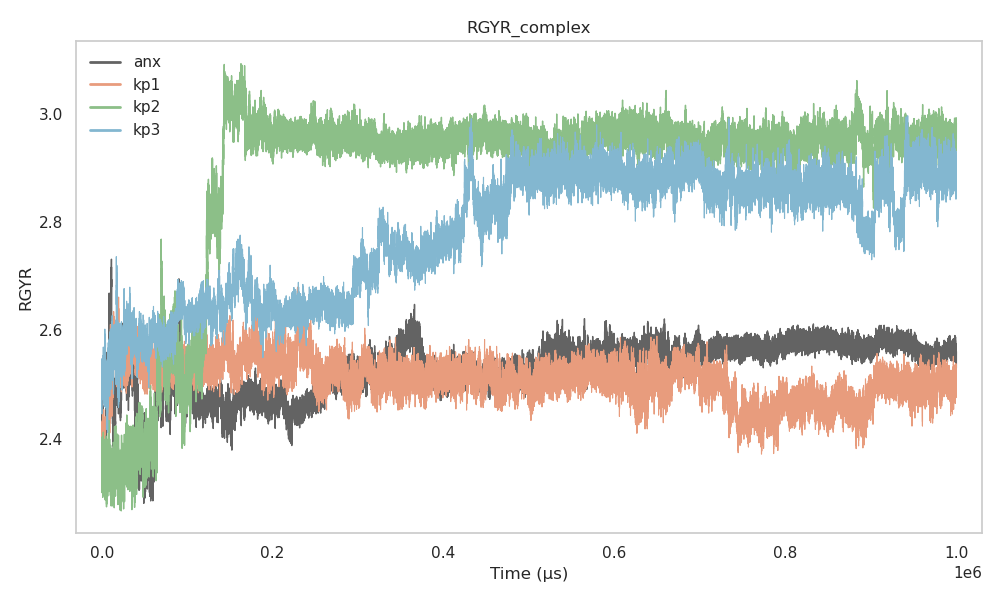
Figure 4:Radius of Gyration vs Time
The similarity in Rg between anx and kp1 suggests that both peptides induce comparable structural organization within the complex.
Hydrogen Bond Analysis
Hydrogen bonds contribute significantly to structural stability. Both the number of hydrogen bonds over time and their distribution were analyzed.
kp3 forms the highest number of hydrogen bonds.
kp2 also shows relatively high hydrogen bond counts.
anx and kp1 show lower but stable hydrogen bond numbers.
Hydrogen bond distributions for anx and kp1 are narrow, indicating consistent interaction patterns.
Figure 5 shows the average number of Hydrogen bond formed during simulation for all peptides.
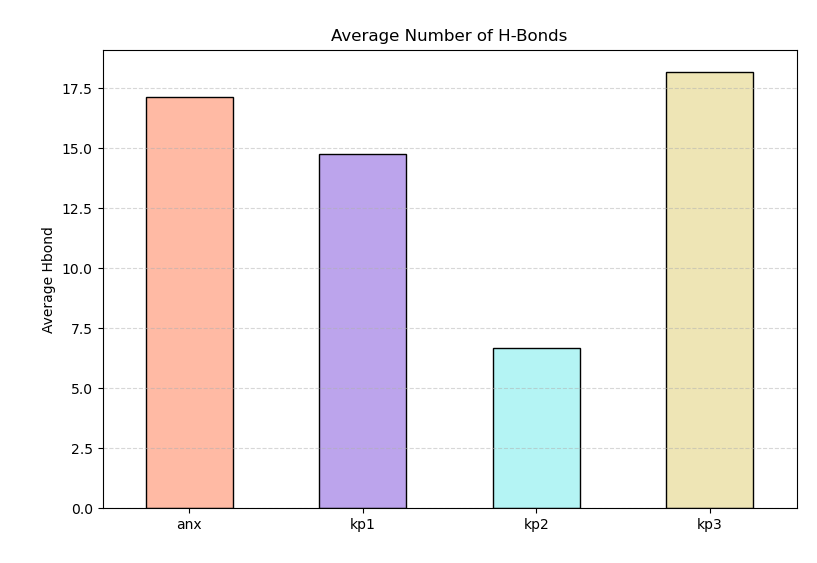
Figure 5:Hydrogen Bond Distribution
Although kp3 forms more hydrogen bonds, its high flexibility suggests compensatory bonding rather than stable folding. In contrast, kp1 and anx maintain balanced and stable hydrogen bonding, consistent with structural similarity.
MM-GBSA Binding Free Energy
MM-GBSA calculations were performed to estimate the binding free energies of anx and microbial peptides (kp1, kp2, and kp3) in complex with the target protein. The computed binding free energy values were shown in Figure 6 for anx, kp1, kp2, and kp3, respectively.
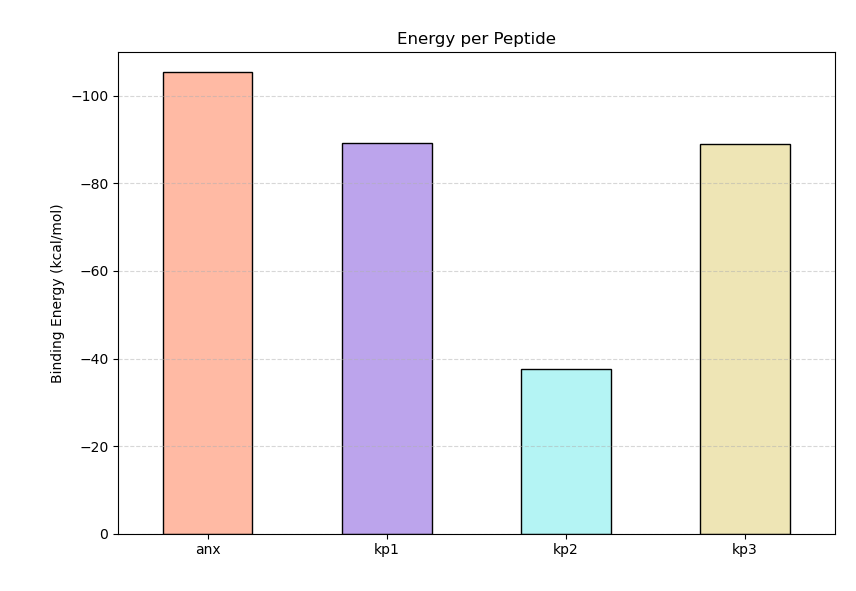
Figure 6:Binding Energy values for anx, kp1, kp2, and kp3
The results indicate that anx forms the most stable complex with the protein, consistent with its low RMSD, low RMSF, and compact radius of gyration observed during the MD simulations. The similar MM-GBSA values for kp1 and kp3 suggest that both peptides maintain moderately stable binding, although kp3 may experience higher conformational flexibility, as indicated by its larger RMSD and RMSF values. In contrast, the substantially lower binding free energy of kp2 reflects weaker intermolecular interactions, likely arising from reduced hydrogen bonding and higher structural fluctuations observed during the trajectory.
Comparision and Mimicry Assessment
Across all analyzed parameters, kp1 consistently shows the closest resemblance to the self-peptide anx in terms of:
Structural stability (RMSD),
Residue-level flexibility (RMSF),
Compactness (Rg),
Solvent exposure (SASA),
Hydrogen bonding behavior.
While kp3 forms more hydrogen bonds, its high flexibility and structural deviation reduce its likelihood of functional mimicry. The summary and comparision of all the parameters obtained after analysis are summarized in Table 1:
Table 1:Summary of MD simulation parameters for anx and microbial peptides
Parameter | anx | kp1 | kp2 | kp3 |
|---|---|---|---|---|
SASA | High | Comparable | Lower | Lower |
RMSD | Low | Low | Moderate | High |
RMSF | Low | Low | Moderate | High |
Radius of Gyration | Low | Similar to anx | High | Highest |
Hydrogen Bonds | Moderate | Moderate | High | Highest |
Overall Stability | High | High | Moderate | Low |